
When we talk about diagnostic tests, we are obsessed with sensitivities and specificities. In many papers, they are the only numbers reported. When we discuss diagnostic tests at conferences, sensitivity and specificity are frequently the only numbers mentioned. Even on First10EM, I have frequently given sensitivity and specificity the leading role when discussing diagnostic tests. Based on the “spIN” and “snOUT” mnemonics, sensitivity and specificity seem straight forward. We have been taught that sensitivity will help us rule disease out and specificity will help us rule disease in. In turns out, that is a complete lie. Most of us don’t really understand what sensitivity and specificity mean, and it has been hurting our patients.
Imagine a patient with a possible subarachnoid hemorrhage (SAH). Based on their presentation, you figure they have about a 10% chance of ultimately being diagnosed with SAH. Imagine a new decision rule that has a 90% sensitivity for subarachnoid hemorrhage. Given that we want to rule this disease out, that sounds promising. The rule only has a 10% specificity, but you figure you can work with a few false positives if the 90% sensitivity helps you rule out SAH. So, how much does the 90% sensitivity decrease your patient’s chance of having a subarachnoid hemorrhage if they pass the rule?
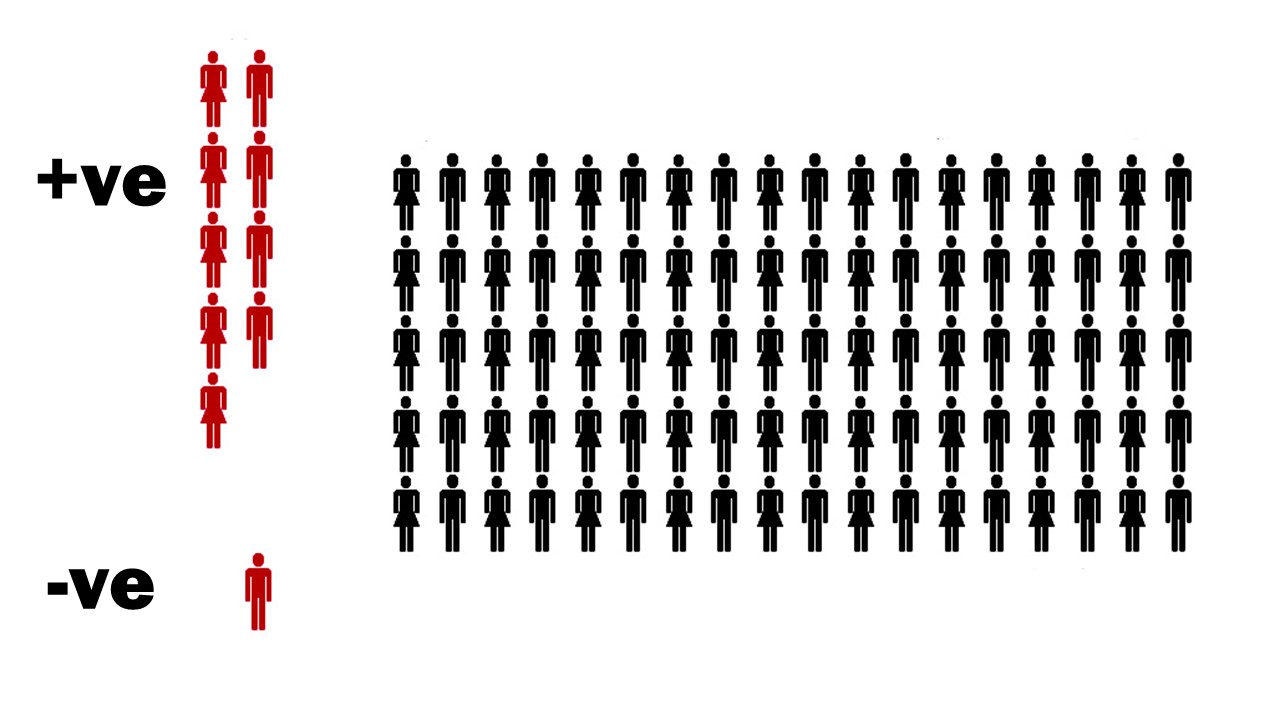
Let’s do the math, but to keep it simple, I will perform the calculations using pictures. Imagine 100 patients coming to the emergency department with headaches. Based on your assessment, you think 10 (or 10%) of these patients will rule in for subarachnoid hemorrhage.

Your decision rule is 90% sensitive, so it will identify 9 out of the 10 patients with disease. That sounds promising. It sounds like this rule could be helpful. If we focus on just the sensitivity, it looks like we will only miss 1 patient in 100, which might be good enough.
This is usually where we stop in medicine. When attempting to rule a disease out, we only look at the sensitivity. That is certainly how I was taught. However, let’s consider the impact of the 10% specificity. There are 90 healthy patients in this cohort, and the 10% specificity means that 81 of them will fail the decision rule, or be false positives. Now, we can start to see the problem.
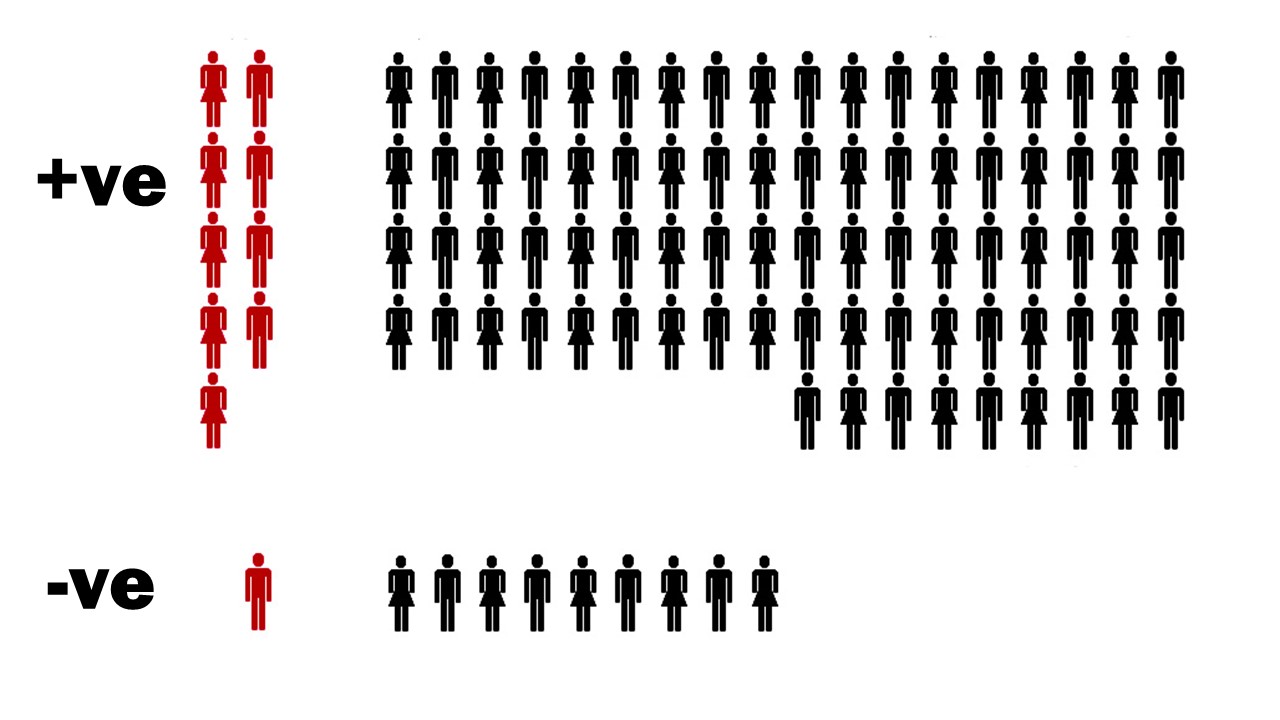
There are 90 patients with ‘positive’ tests and 9 of them have a subarachnoid hemorrhage. In other words, if you fail the decision rule, you have a 10% chance of having a subarachnoid hemorrhage. There are 10 patients with ‘negative’ tests, and 1 has a subarachnoid hemorrhage. In other words, if you pass the decision rule, you have a 10% chance of having subarachnoid hemorrhage.
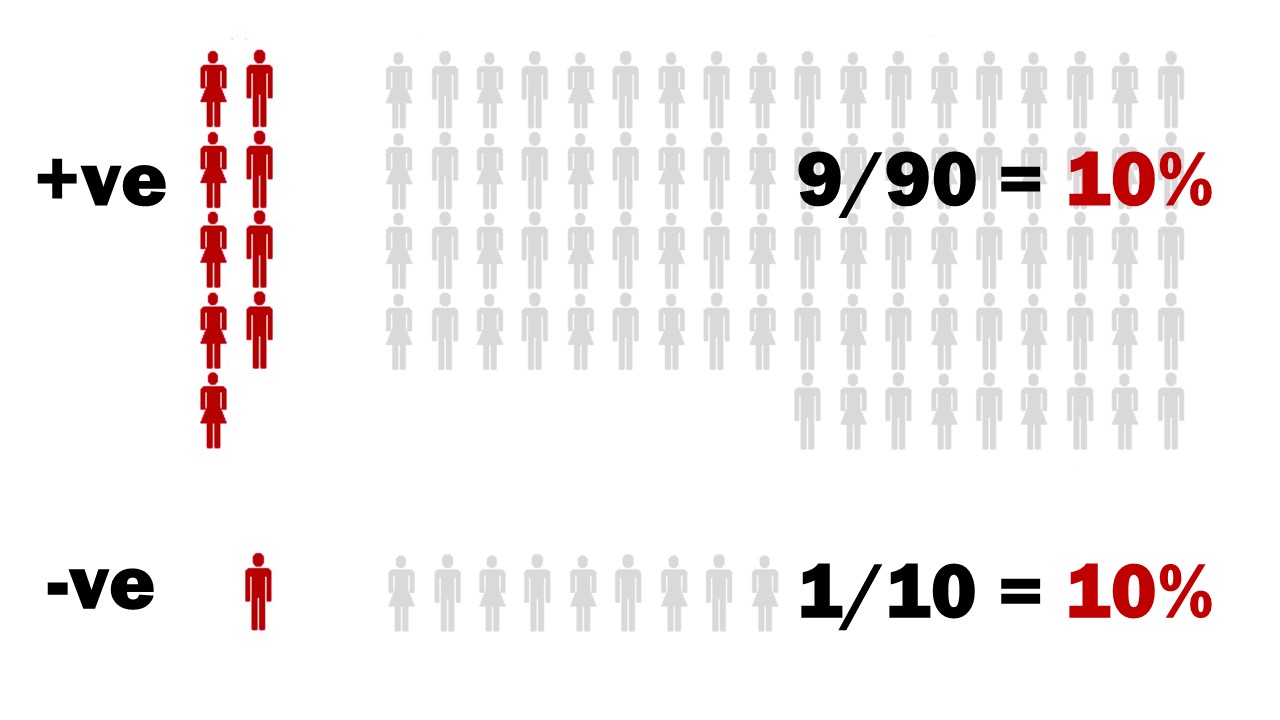
This was a test with a 90% sensitivity. It was supposed to help us rule out disease. Instead, we have the exact same chance of disease before and after the test, no matter what the result!
When this was first explained to me, my mind was absolutely blown. Everything I had been taught about sensitivity and specificity was a lie. Sensitivity is supposed to help rule disease out (snOUT). How is it possible that a test with a 90% sensitivity (significantly better than many of the tests we use every day in emergency medicine) didn’t change the patient’s chance of disease at all?!
It turns out, you can’t consider just the sensitivity or just the specificity in isolation. Although that is exactly how we talk about these measures, they are absolutely useless on their own. In order to figure out whether a test is helpful, you have to consider both sensitivity and specificity together, or – as I will suggest – use a more useful numbers like likelihood ratios, and just stop talking about sensitivity and specificity altogether.
We make this mistake all the time in medicine. We adopt tests based on just the sensitivity or just the specificity. We use these tests, but clearly we don’t understand how they really work. Consider the Ottawa subarachnoid hemorrhage rule. Based on an excellent sensitivity, there are many who are widely pushing its use. However, the actual numbers for the Ottawa subarachnoid hemorrhage rule are a sensitivity of approximately 100% (with 95% confidence intervals down to 95-97%) and a specificity between 7.5 and 15%. (Perry 2017; Bellolia 2014; Chu 2018; Perry 2020) I just demonstrated that a test with a 90% sensitivity and 10% specificity is completely useless; does not change a patient’s chance of subarachnoid hemorrhage at all. Does this rule sound much better?
This shouldn’t have come as a surprise. By definition, sensitivity and specificity are clinically useless. Sensitivity is defined as the percentage of patients with a disease who are accurately identified by a positive test. It’s a measure of the accuracy of a test in a group of patients known to have the disease. Clinically, we don’t know if a patient has a disease. That is exactly why we are ordering a test. So the very definition of sensitivity tells us that it is not a measure we should be applying in a clinical setting.
Predictive values can also be misleading
When we order tests, what we really want to know is, if the test is positive, what are the chances that this patient actually has the disease? Or, conversely, if the test is negative, what are the chances that the patient doesn’t have the disease? The positive and negative predictive values, respectively, tell us exactly that. If the positive predictive value is 95%, and the patient tests positive, there is a 95% chance that the patient has the disease.
This sounds like the perfect measure. It appears to tell us exactly what we need to know as clinicians. Unfortunately, the predictive values have a fatal flaw: they are inherently tied to the prevalence of the disease in the patients you are testing. You can’t generalize the number from one group to another. Just because a study states that a test has a negative predictive value of 99% doesn’t mean that it will be 99% for your patient, and that is obviously a problem.
This is best understood with a simple example. Imagine using a coin flip to decide whether a patient has a pulmonary embolism (PE). In an emergency department setting, where 10% of patients being tested have a PE, when the coin comes up heads or “positive”, 10% of patients will have a PE, so the positive predictive value of my coin flip is 10%. When the coin comes up tails or “negative” 10% of patients have PE, and so the negative predictive value of the coin flip is 90%. In this setting, it is pretty obvious that the coin flip is not very good at diagnosing PE.
However, imagine that I decide to test the exact same coin flip in a PE follow up clinic, where 100% of patients are known to have PE. Now, when my coin flip comes up heads, 100% of patients have PE. My coin flip has a 100% positive predictive value for pulmonary embolism! I could probably get this published in a major medical journal (if the test was more expensive and someone was going to profit).
Conversely, if I decide to test my coin in asymptomatic individuals visiting their doctor for a yearly physical, I can generate the opposite results. Now, when the coin comes up tails, 0% of patients have PE, so my coin flip has a negative predictive value of 100%! It’s a perfect test – except obviously it’s not.
So predictive values can also be very misleading. These examples sound extreme, but are well represented in the medical literature. We have tested coronary CT angiograms in populations where 0% of patients have bad outcomes, and then gleefully proclaimed that CCTA has an amazing negative predictive value. Hopefully it is now obviously why such statements are ridiculous.
Although predictive values are closer to what we want to know when working clinically, they can clearly still be very misleading. Like the sensitivity and specificity, I think we would be better off if we just stopped talking about these numbers.
Likelihood ratios: the diagnostic number that really matters
We need a measure that incorporates the risk of the patient in front of us and tells us how much that risk changes when the test is positive or negative. The solution is likelihood ratios.
A likelihood ratio (as is implied by the name) is a ratio of two different probabilities: the probability of a patient with a condition having a given test result divided by the probability of a patient without a condition having the given test result. (The only difference between the positive and negative likelihood ratio in this formula is whether you are talking about the test result being positive or negative.)


At face value, this sounds a little complicated, but the result is exactly what we need clinically. When working clinically, we want to know what a test result means for the specific patient in front of us. The likelihood ratio will give you a number that adjusts your pre-test probability into exactly what you want: the chance that this specific patient has the disease given the test result you just got back.
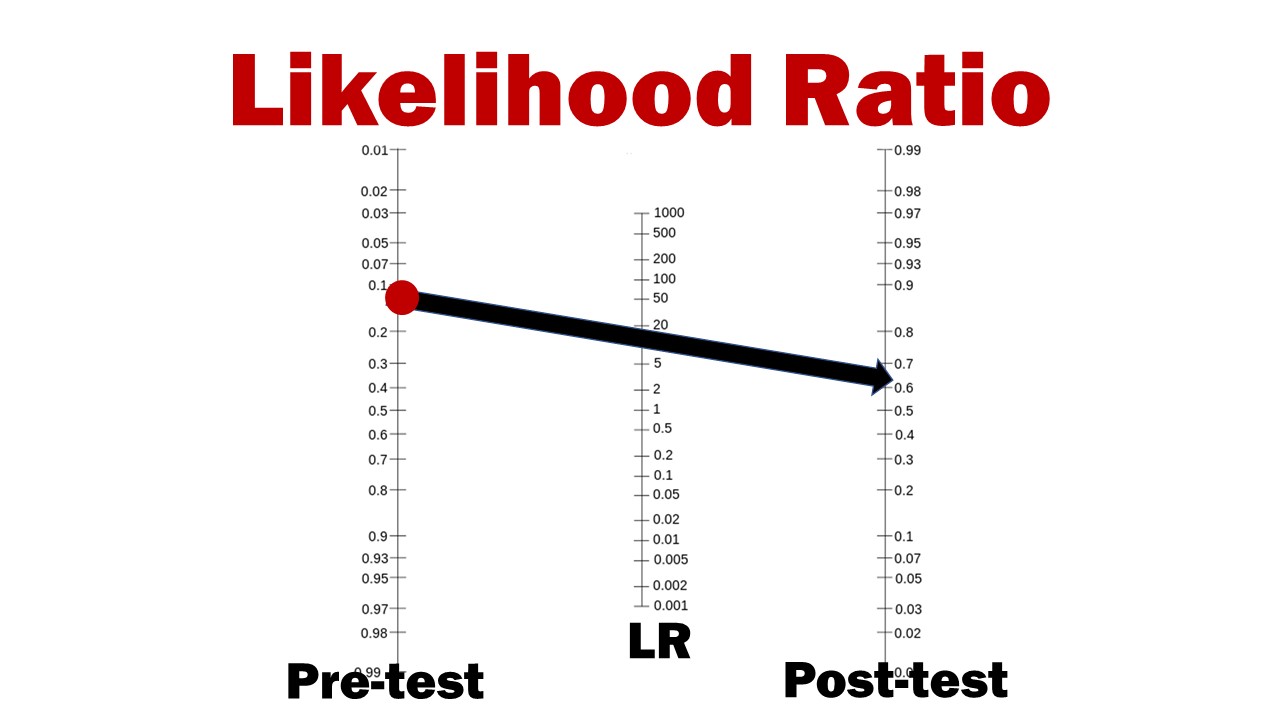
The overall concept is very easy. You take your pretest probability and multiply it by the likelihood ratio and you get the posttest probability. Unfortunately, the math gets a little complex, because it uses odds, but the basic concept is simple. If you multiple by 1, your odds don’t change at all, so a test with a likelihood ratio of 1 is completely useless. If you multiple by a big number (say bigger than 10) then your chances of disease go up by a lot. If you multiple by a small number (say smaller than 0.1) then your chances of disease go down by a lot.
If you want to get more specific than that, you can use the Fagan nomogram. It is incredibly easy. You just start with your pretest probability on the left, draw a line through your likelihood ratio, and it tells you your posttest probability on the right. Better yet, these days you can just use one of the many online calculators.
Bottom line
Sensitivity and specificity have been lying to us. The spIN / snOUT mnemonic that we all learned is incorrect. Sensitivity cannot be considered without specificity, and specificity cannot be considered without sensitivity. These numbers are counter-intuitive and don’t provide us with the information that we need clinically. We should stop using them.
When using a diagnostic test, you must first know your patient’s pretest probability. Once you know the pretest probability, it is the likelihood ratio that will give you the information you need.
References
Bellolio MF, Hess EP, Gilani WI, VanDyck TJ, Ostby SA, Schwarz JA, Lohse CM, Rabinstein AA. External validation of the Ottawa subarachnoid hemorrhage clinical decision rule in patients with acute headache. Am J Emerg Med. 2015 Feb;33(2):244-9. doi: 10.1016/j.ajem.2014.11.049. Epub 2014 Dec 3. PMID: 25511365
Chu KH, Keijzers G, Furyk JS, et al. Applying the Ottawa subarachnoid haemorrhage rule on a cohort of emergency department patients with headache. Eur J Emerg Med. 2018;25(6):e29-e32. doi:10.1097/MEJ.0000000000000523 PMID: 29215380
Perry JJ, Sivilotti MLA, Sutherland J, et al. Validation of the Ottawa Subarachnoid Hemorrhage Rule in patients with acute headache [published correction appears in CMAJ. 2018 Feb 12;190(6):E173]. CMAJ. 2017;189(45):E1379-E1385. doi:10.1503/cmaj.170072 PMID: 29133539
Perry JJ, Sivilotti MLA, Émond M, et al. Prospective Implementation of the Ottawa Subarachnoid Hemorrhage Rule and 6-Hour Computed Tomography Rule. Stroke. 2020;51(2):424-430. doi:10.1161/STROKEAHA.119.026969 PMID: 31805846
Worster A, Carpenter C. A brief note about likelihood ratios. CJEM. 10(5):441-2. 2008. PMID: 18826732
Morgenstern, J. The sensitivity and specificity are lying to you, First10EM, February 8, 2021. Available at:
https://doi.org/10.51684/FIRS.73339


16 thoughts on “The sensitivity and specificity are lying to you”
Couldn’t agree more ! LR (and IRR) are the numbers of tests we should be most concerned about (as well as all the usual stuff such as whether the LR comes from a population similar to ours etc)
The problem is not with the sensitivity and specificity values. The problem is in their non-careful interpretations. What you describe is a typical Bayesian fallacy, and as you justly point out, it is a common fallacy – not only in this example. The chances of A given B and the chances of not(A) given not(B) (where A is “is true” and B is “came out true in the test”), by themselves are not sufficient, and one has to know something about the base sample.
However the data besides the specificity, and sensitivity, is not a property of the test kit.
It is a confusion between the chances of A given B, and the chances of B given A, and Bayes theorem relates the two, but there is a need for extra data, which is not part of the test kit.
A typical example of the problem, is with the tests for drunk drivers using the breathalyzer check. It has a fairly low chance of false positive, and as long as you use it to verify that someone that seems drunk is indeed drunk, it is fine, but once the police uses it to test occasional drivers, the number of false positives will outnumber the number of true-positives by far.
I find predictive values more useful in some situations. This is because LR also has its limitations. When you apply LR you are assuming that the sensitivity and specificity always holds. But in reality, due to spectrum bias, this is most likely not true. If this is the case, I think we should use predictive values, which are rough but simpler and closer to the truth rather than sticking to a fine calculation which is not true anyway.
Although spectrum bias will affect LRs, it has a much bigger effect of predictive values. I think predictive values are much more likely to mislead. The goal with LRs is not to calculate a precise-test probability. We all know there are error bars and uncertainty. The goal is to ensure we are in the right ball park, and not make the kind of diagnostic errors that we frequently make, such a those discussed here – https://first10em.com/why-pretest-probability-is-essential/
Thank you for your reply. Actually, I’m a long time fan of your blog! Yes, I agree with you, pretest probability is the most important. That is why I said “in some situations”. However, when you can assume your pretest probability is lower (when rule-out) than a study, you can use negative predictive value safely.
That is true, but in that case there is no real benefit of using the predictive value over the likelihood ratio. You are already having the employ the pretest probability, you might as well use the statistic designed to adjust that pretest probability.
I believe predictive values are more useful in some situations, because it is more difficult to estimate precise pretest probabilities.
I believe predictive values are more useful in some situations, because it is often more difficult to predict precise pretest probabilities. If pretest probabilities can be safely taken into account, there is no need for complicated calculations.
And thanks for the comments. These posts are way more fun and informative when they end up being interactive.
I will also say, I am a clinician and not a mathematician. I was using sensitivity and specificity wrong for years. I don’t think I am wrong here, but I have been wrong before, and am always open to being shown my errors.
I’m a clinician, too.
Nearly always agree with you, but going to have to disagree here! EBM folks have been pushing LR for years, and yet clinicians persist with using sens and spec. Why? I think it’s because sens and spec contain more information than LR, provided they are used properly.
LR is a product of the sens and spec; but by converting sens/spec into one number we lose vital information. For example, the LR+ for bulging fontanelle in peds meningitis is 8 (https://pediatrics.aappublications.org/content/126/5/952), making this a really useful exam finding, right!? Actually, it only has 14% sensitivity (but 98% specificity), hugely limiting its utility. Alternatively, an LR of 8 could mean 100% sens and 88% spec, which arguably would make it much more useful: it is now a perfect rule out test. But if all I know is the LR, I don’t know this! A diligent clinician could learn only the highest LR history and exam findings of a disease, but remain totally incapable of recognising it if they all had the test characteristics of a bulging fontanelle in peds meningitis.
Of course sens and spec have limitations, mostly due to spectrum bias. But if sensitivity and specificity should be updated at all, it may be to simplify things even further. Namely, just teach people the % positive in those with disease and those without (i.e. ‘sensitivity’ and ‘false positive rate’). No need to learn any special terminology (sensitivity, specificity), just basic primary school knowledge about %. This would make it very easy to recognise the mistake in your first example, as instead of trying to extrapolate what 90% sensitivity and 10% specificity mean, you would just know immediately that the test is 90% positive in both groups and thus useless. As an aside, I think the same principle can resolve the endless debate about the merits of absolute vs. relative effect measures in reporting trial results. Just report the % outcome in both arms – this allows you to immediately grasp both the relative and absolute magnitude of the difference, which both matter. ‘Simplifying’ things into one number is not always helpful!
Thanks for the comment
The argument that clinicians continue to use sensitivity and specificity doesn’t hold a lot of water. Clinicians also prescribe PPIs for GI bleeds, heparin for NSTEMIs, antibiotics for colds, and tPa for strokes. Common clinical use is in no way a barometer of scientific accuracy or value. I think you if asked 1,000 clinicians why they used sensitivity and specificity over likelihood ratios, 999 would have no answer other than ‘that is how I was taught’. (On the other hand, the fact that scientists and mathematicians have been long imploring us to use likelihood ratios is a pretty good argument that we should, in fact, be using likelihood ratios.)
I think your example of the bulging fontanelle is a good example of why likelihood ratios are actually better. The key part that you left out is the negative likelihood ratio, which will be very close to 1. In other words, the likelihood ratios tell us that this is a finding that increases probability of disease significantly, but not enough to rule it in in most populations, but doesn’t decrease probability at all. If you need more precise numbers, you can actually do the math. Conversely, the sensitivity and specificity give you absolutely no sense of the chances of a specific baby having meningitis. You find a bulging fontanelle in a well, afebrile child at a well baby check – the 98% specificity gives you the sense that meningitis should be on your differential, but the +LR of 8 tells you that based on your essentially 0% pretest probability, the diagnosis of meningitis is still unlikely. Exactly how unlikely might actually matter in this case. You can’t work that out based on sensitivity and specificity (unless you use them to calculate the likelihood ratios). But the likelihood ratios let me consider the incidence of meningitis in my community, and come up with a realistic estimation of post-test probability.
I agree with you that presenting more numbers, and improving overall numerical literacy is ideal. However, that is a far cry from our current state. We currently basically use sensitivity and specificity in isolation. If you are going to use a single measure, likelihood ratios are far better. If you want to add a good understanding of the meaning of sensitivity and specificity on top of that, brilliant, but people need to understand the likelihood ratios first or we will continue making the same diagnostic mistakes we are currently making.
There should be two numbers, and in fact the right numbers should be the direct answers to the right question:
GOOD QUESTION A: What is the chance that someone is positive/negative once we know that IT CAME positive the test.
GOOD QUESTION B: what is the chance that someone is positive/negative IF WE KNOW that it came negative in the test.
The specificity and sensitivity values do not give answers to those questions.
What the specificity, and sensitivity values can give us, is an answer to two different questions:
Question C (sensitivity): What are the chances that the test comes out positive/negative IF WE KNOW that the person is positive.
Question D (specificity): What are the chances that the test comes out positive/negative IF WE KNOW that the person is negative.
The two likelihood ratios that you mentioned in the post are not the ones that you need. In fact they can be calculated from the sensitivity and specificity of the test kits, and vice versa. There is no way from those calculated likelihood ratios to get answers to good questions A, and B.
Unfortunately, in order to get answers to the good questions we need some extra information about the a-priori chances in the general populations, and this is the Bayes equation.
A Bayes equation for good question A:
If we mark by X the chances that someone is negative given that the test came out positive, and by Y, the apriori chances for a member of the relevant community, to come out positive in the test. By Z the chances that someone comes out positive if he is negative, and by W the a-priori chance for being negative, then X is the question you wish to ask, and Z is the chance for false positive, and the equation, is X=Z*W/Y
A Bayes equation for good question B:
If we mark by P the chances that someone is positive given that the test came out negative, and by Q, the apriori chances for a member of the relevant community, to come out negative in the test. By R the chances that someone comes out negative if he is positive, and by S the a-priori chance for being positive, then P is the question you wish to ask, and R is the chance for false negative, and the equation, is P=R*S/Q
I know I’m coming to this comment a bit late, but even after much thought (as a non-native speaker), I’m not sure I understood it correctly. This long article wants to tell us that instead of looking at specificity and sensitivity based on their numbers, we should form a quotient from these two numbers? What benefit will this bring (outside of the assumption that we’re all too dumb to properly evaluate these two values on our own)? By calculating sensitivity / (1 – specificity), I don’t improve the statement power of both values. Of course, one should not consider either in isolation. But nobody does that anyway.
I think there are 2 parts to your questions
1) I think many many people do consider sensitivity without specificity and vice versa. Decision rules, for example, are often promoted for having 100% sensitivity, no matter what their specificity. These two measures are taught as if they are completely independent.
2) More important, the sensitivity and specificity are clinically meaningless. This is from the text: “Sensitivity is defined as the percentage of patients with a disease who are accurately identified by a positive test. It’s a measure of the accuracy of a test in a group of patients known to have the disease. Clinically, we don’t know if a patient has a disease. That is exactly why we are ordering a test. So the very definition of sensitivity tells us that it is not a measure we should be applying in a clinical setting.”
If you send a test with a sensitivity of 90% on a patient and it comes back negative, that sensitivity does not tell you what the chances of you patient having the disease are. You cannot use it to determine the status of your patient, because the sensitivity is not related to the status of your patient.
You need to know the pretest probability and you need to know a completely different test characteristic: the likelihood ratio, which I discuss more here: https://first10em.com/why-pretest-probability-is-essential/
From a biostatistician’s point of view, it is really meaningless to argue over the “usefulness” of the combination of [sensitivity, specificity] v.s. the combination of [LR+, LR-]. The information they carry are mathematically equivalent. From [sensitivity, specificity], you can calculate [LR+, LR-]; and from [LR+, LR-], you can back-calculate [sensitivity, specificity]. In fact, if you only know any 1 of {Sn, Sp, LR+, LR-}, you knowledge about the test is incomplete, but if you know any 2 of {Sn, Sp, LR+, LR-}, you can derive the rest. And if you look closer, LR+ is just the slope of the line joining a point in your ROC curve (the chosen cutoff of the test) with the origin, and hence it must be >1 to given any discriminatory power better then chance alone (i.e. the diagonal).
Now, the point is, the most important thing you need, outside of the characteristics of the test, is the pre-test probability, which is actually just another way of saying the prevalence of the condition in the particular population where your patient belongs. With this information, you can derive PPV and NPV either using [Sn, Sp] or [LR+, LR-], it doesn’t really matter. PPV and NPV are those numbers that really matter.
You wrote in your article that PPV and NPV can be misleading because you can’t really obtain the appropriate prevalence for the particular population where your patient belongs. However, you seems unaware that this exact limitation also apply to your LR’s. Because to use your LR’s, you need pre-test probability. Pre-test probability is actually the prevalence for that specific population. Say, your patient is a 20-year-old female with head injury after car accident, with GCS = 5. Your think the pre-test probability of SAH is 20% (I am no clinician, just bare with this make-up number for now). This is actually equivalent of assuming that the prevalence of SAH is 20%, in a population consisting of all 20-y.o. females with head injury post car accident and GCS of 5.
Thus, the crux of the issue is never [Sn, Sp] v.s. [LR+, LR-]. The main point is you must know, or ASSUME, a pre-test probability (= prevalence for a highly specific population) to interpret any test, and the final measures you need are always PPV and NPV.